Flow Sheets are used for the entry of data over time and are frequently used for vitals and other data that would be helpful to view in this format. The Flow Sheets screen allows you to visualize data using dynamic graphs.
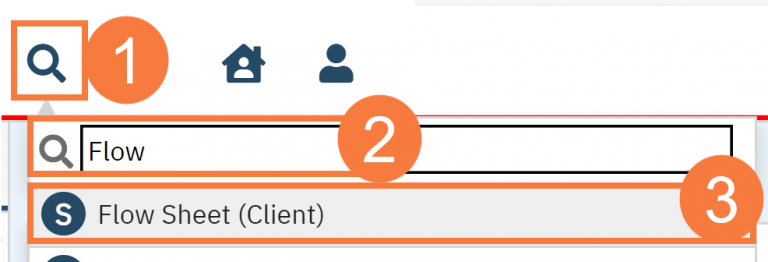
With an active client selected, click the Search icon.
Type Flow into the search bar.
Click to select Flow Sheet (Client).
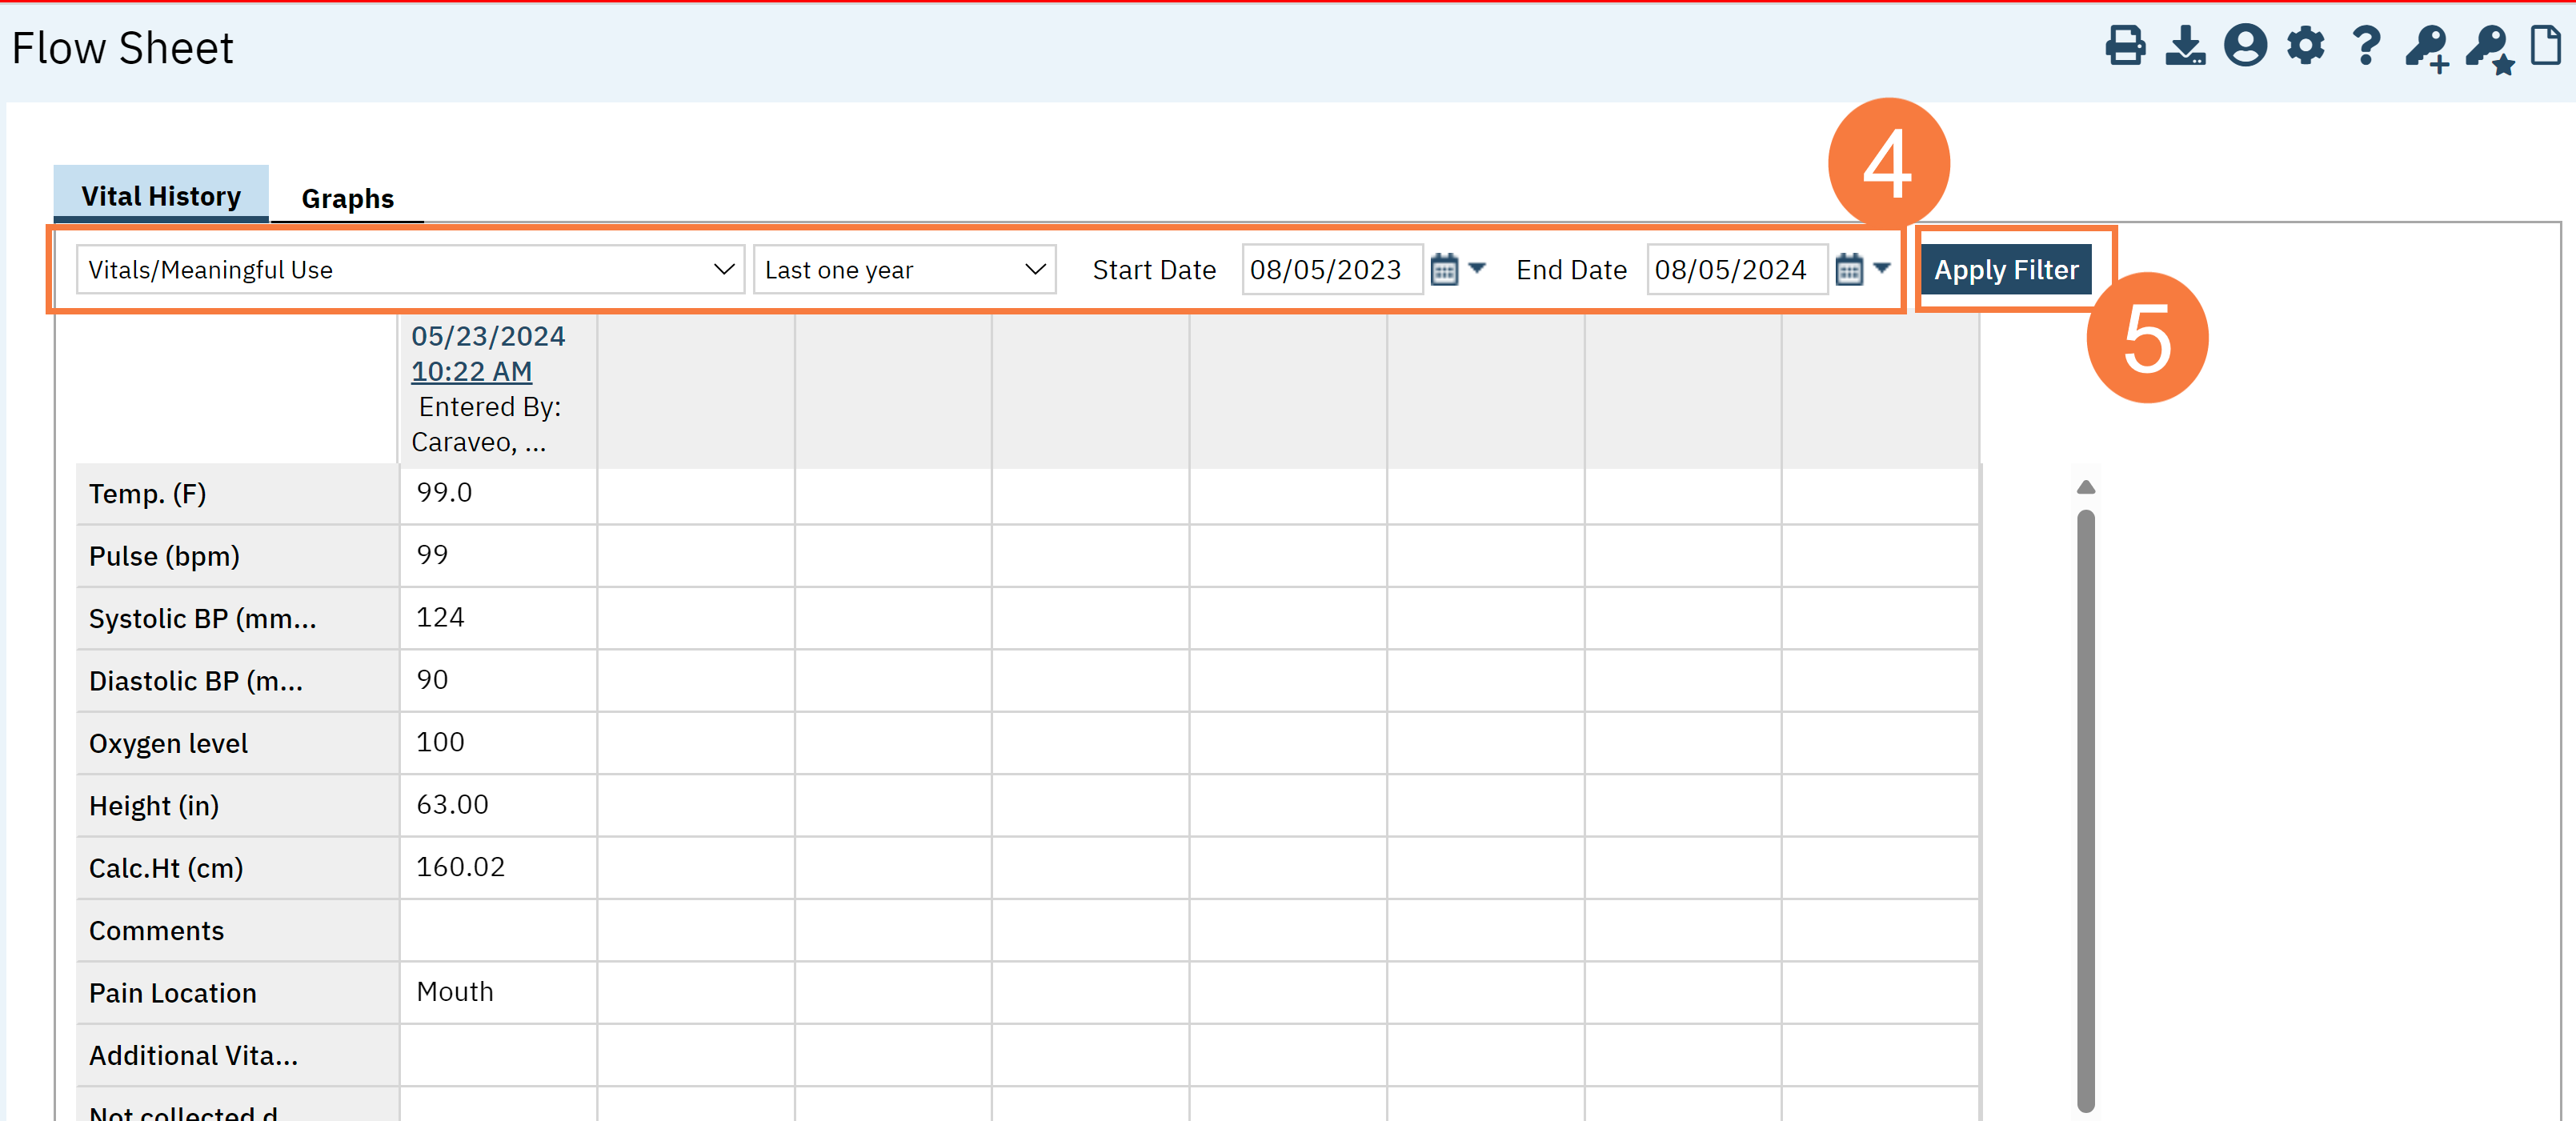
The Flow Sheets screen opens. The Flow Sheet drop-down menu and date range will default to how the flow sheet is set up. If no sheet is found, an alert will be displayed instead.
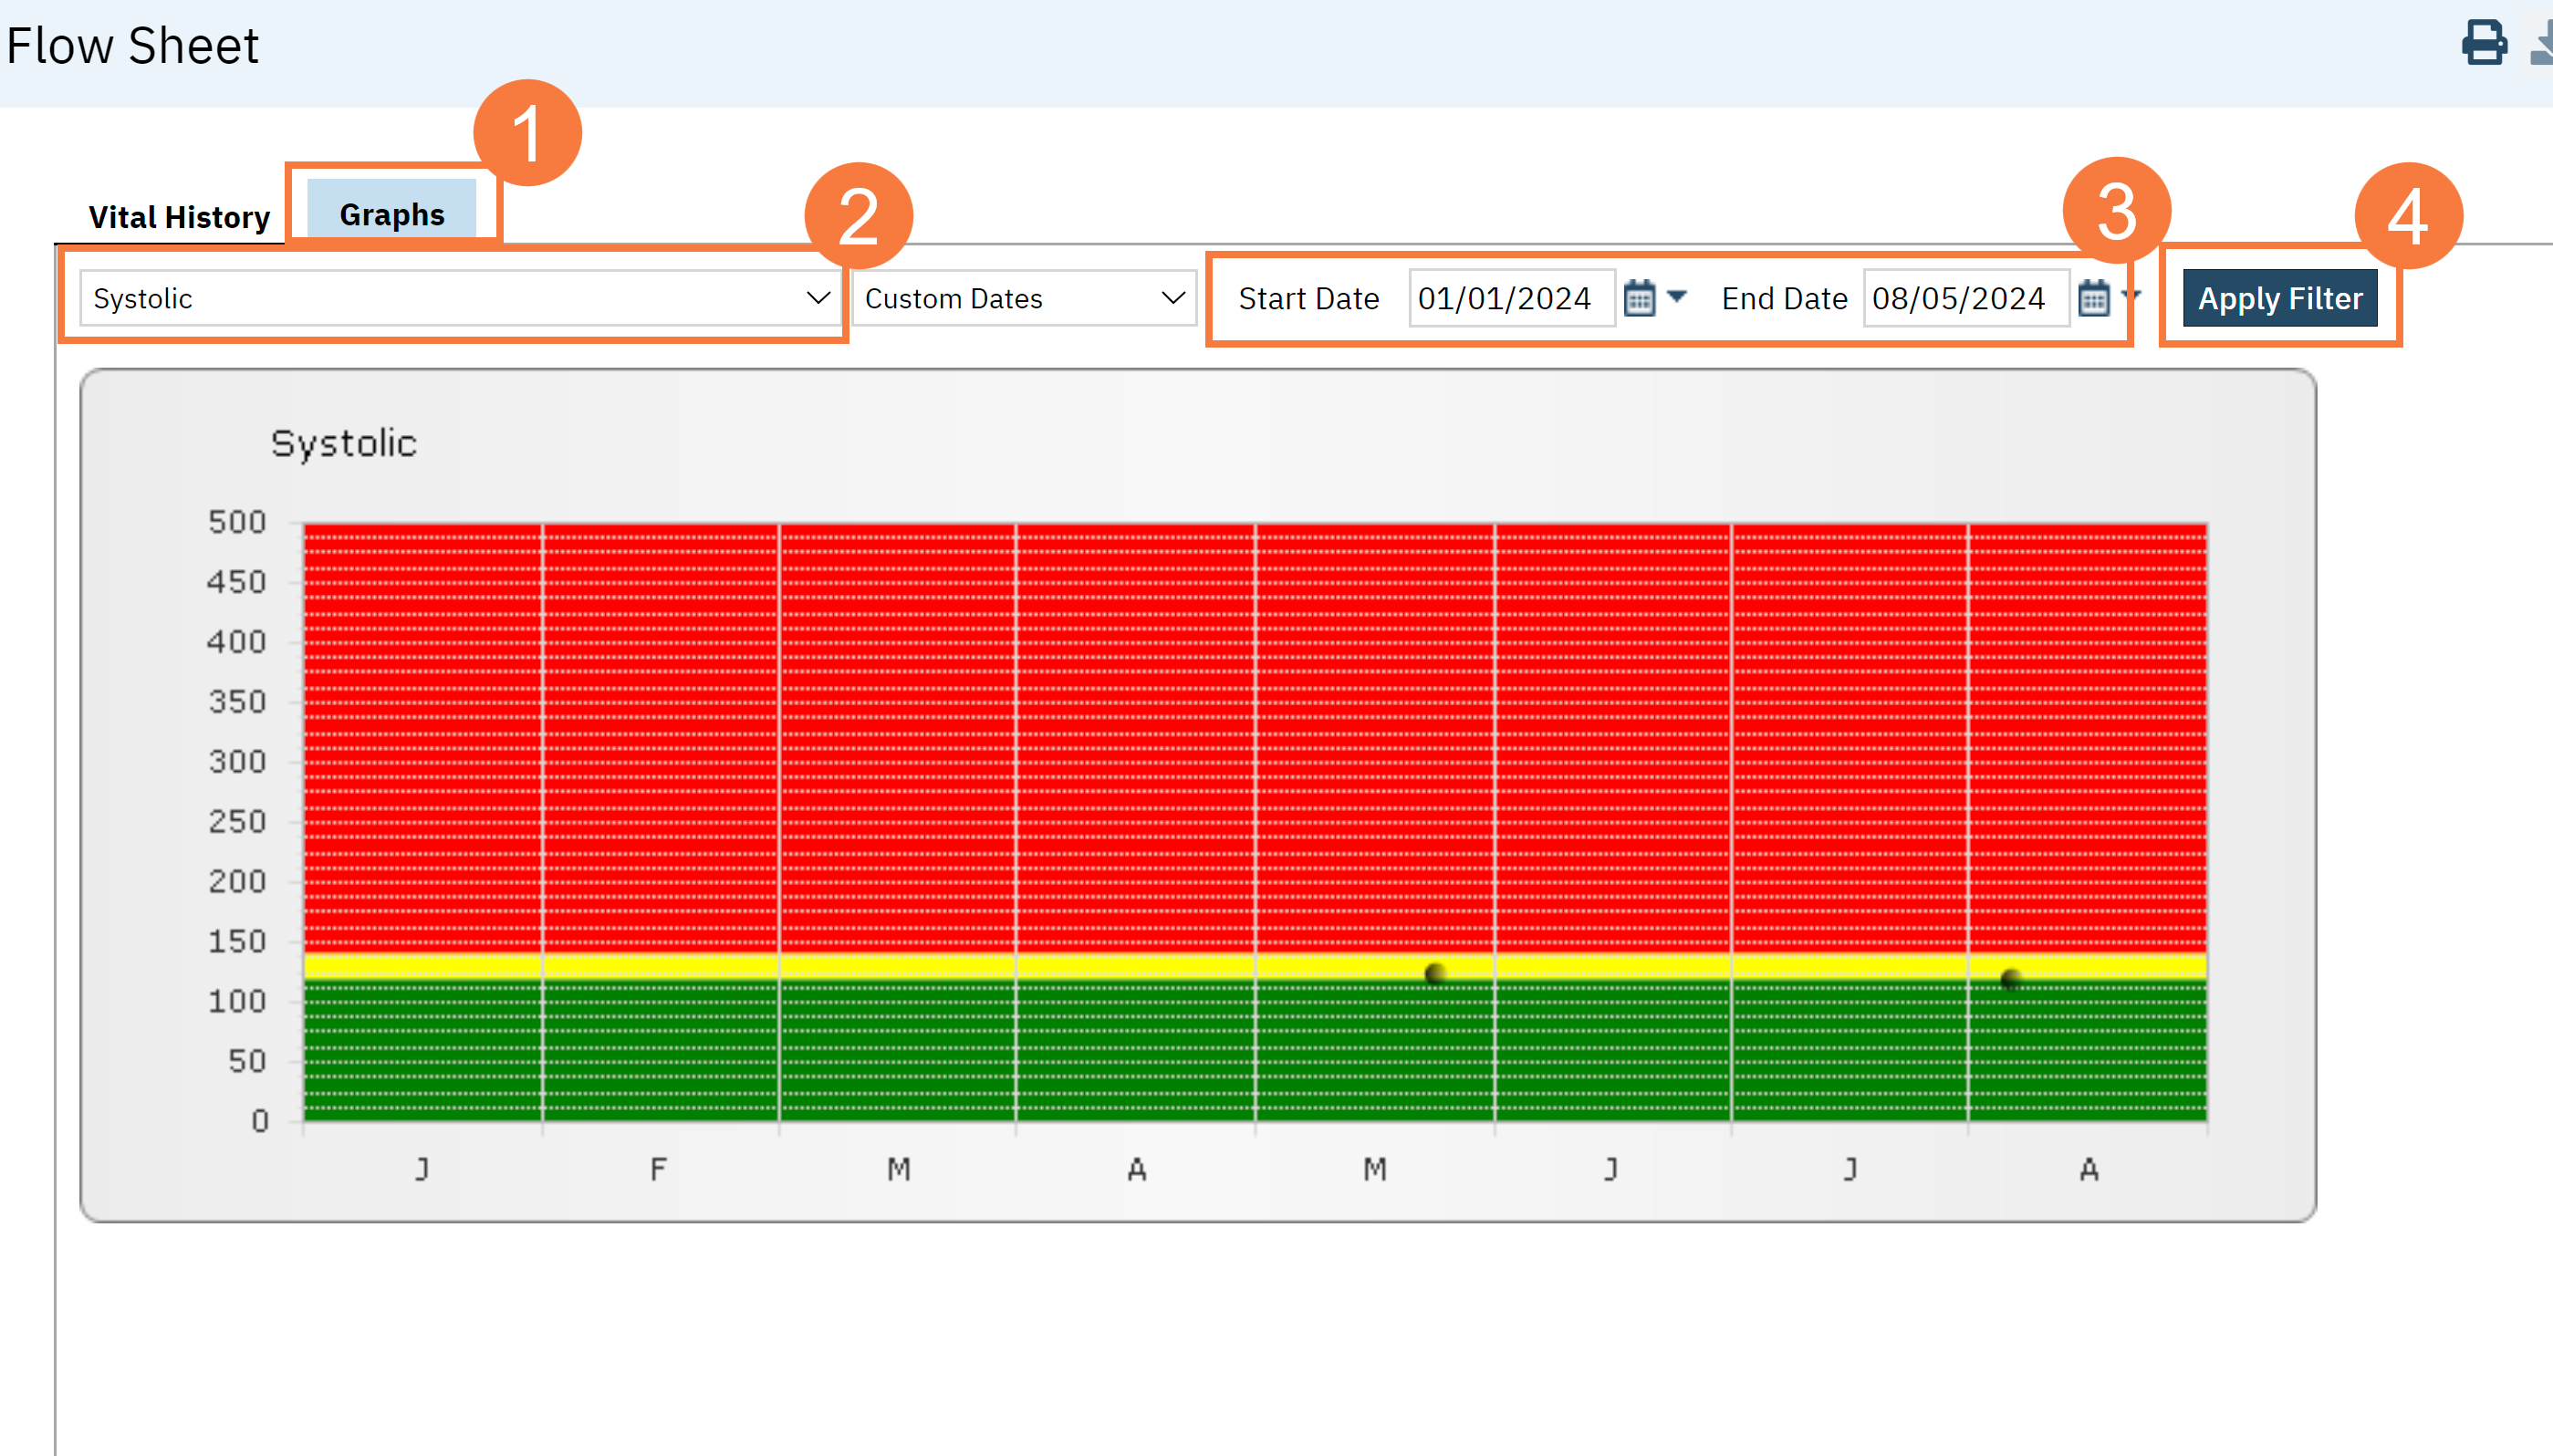
To view a particular Flow Sheet, click the drop-down menu to select the appropriate flow sheet and select a date range.
Click the Apply Filter button. The Information will display in the grid below.
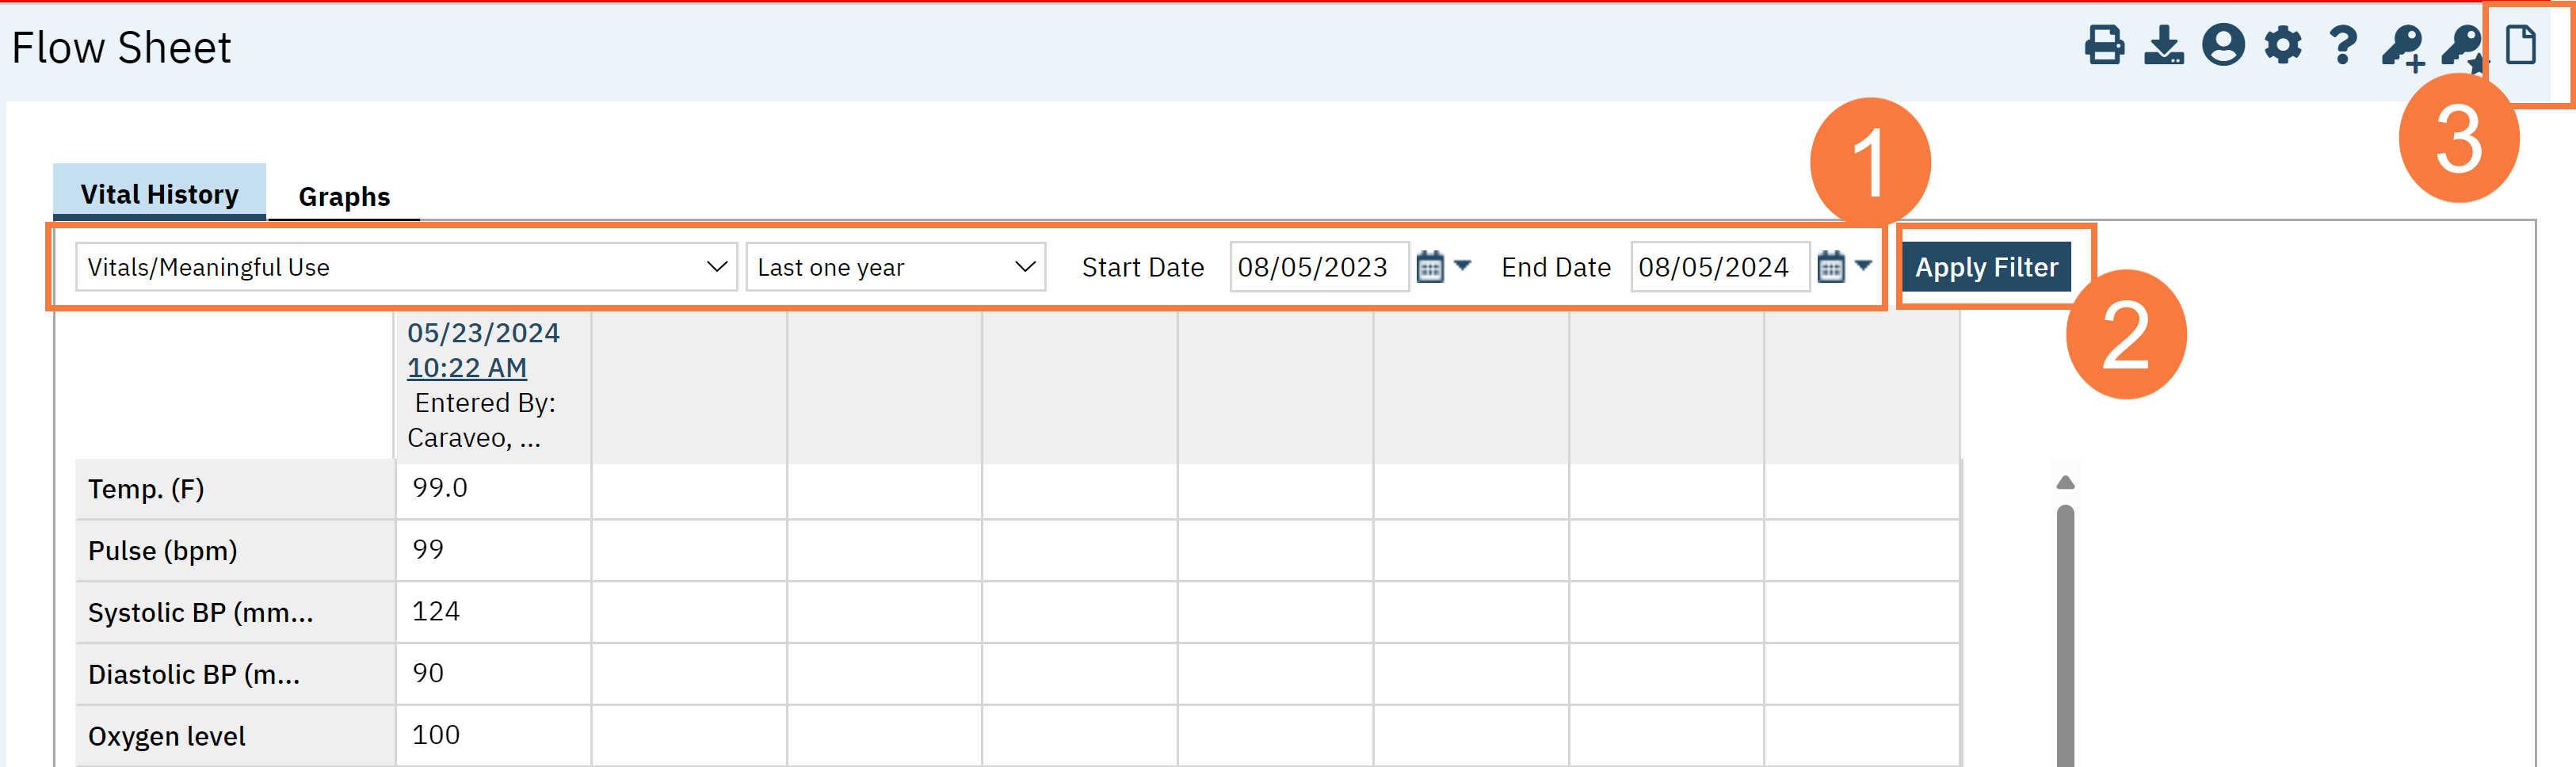
How to Add a New Enty
Click the drop-down menu to select the appropriate flow sheet and select a date range.
Click the Apply Filter button. The Information will display in the grid below.
Click the New icon
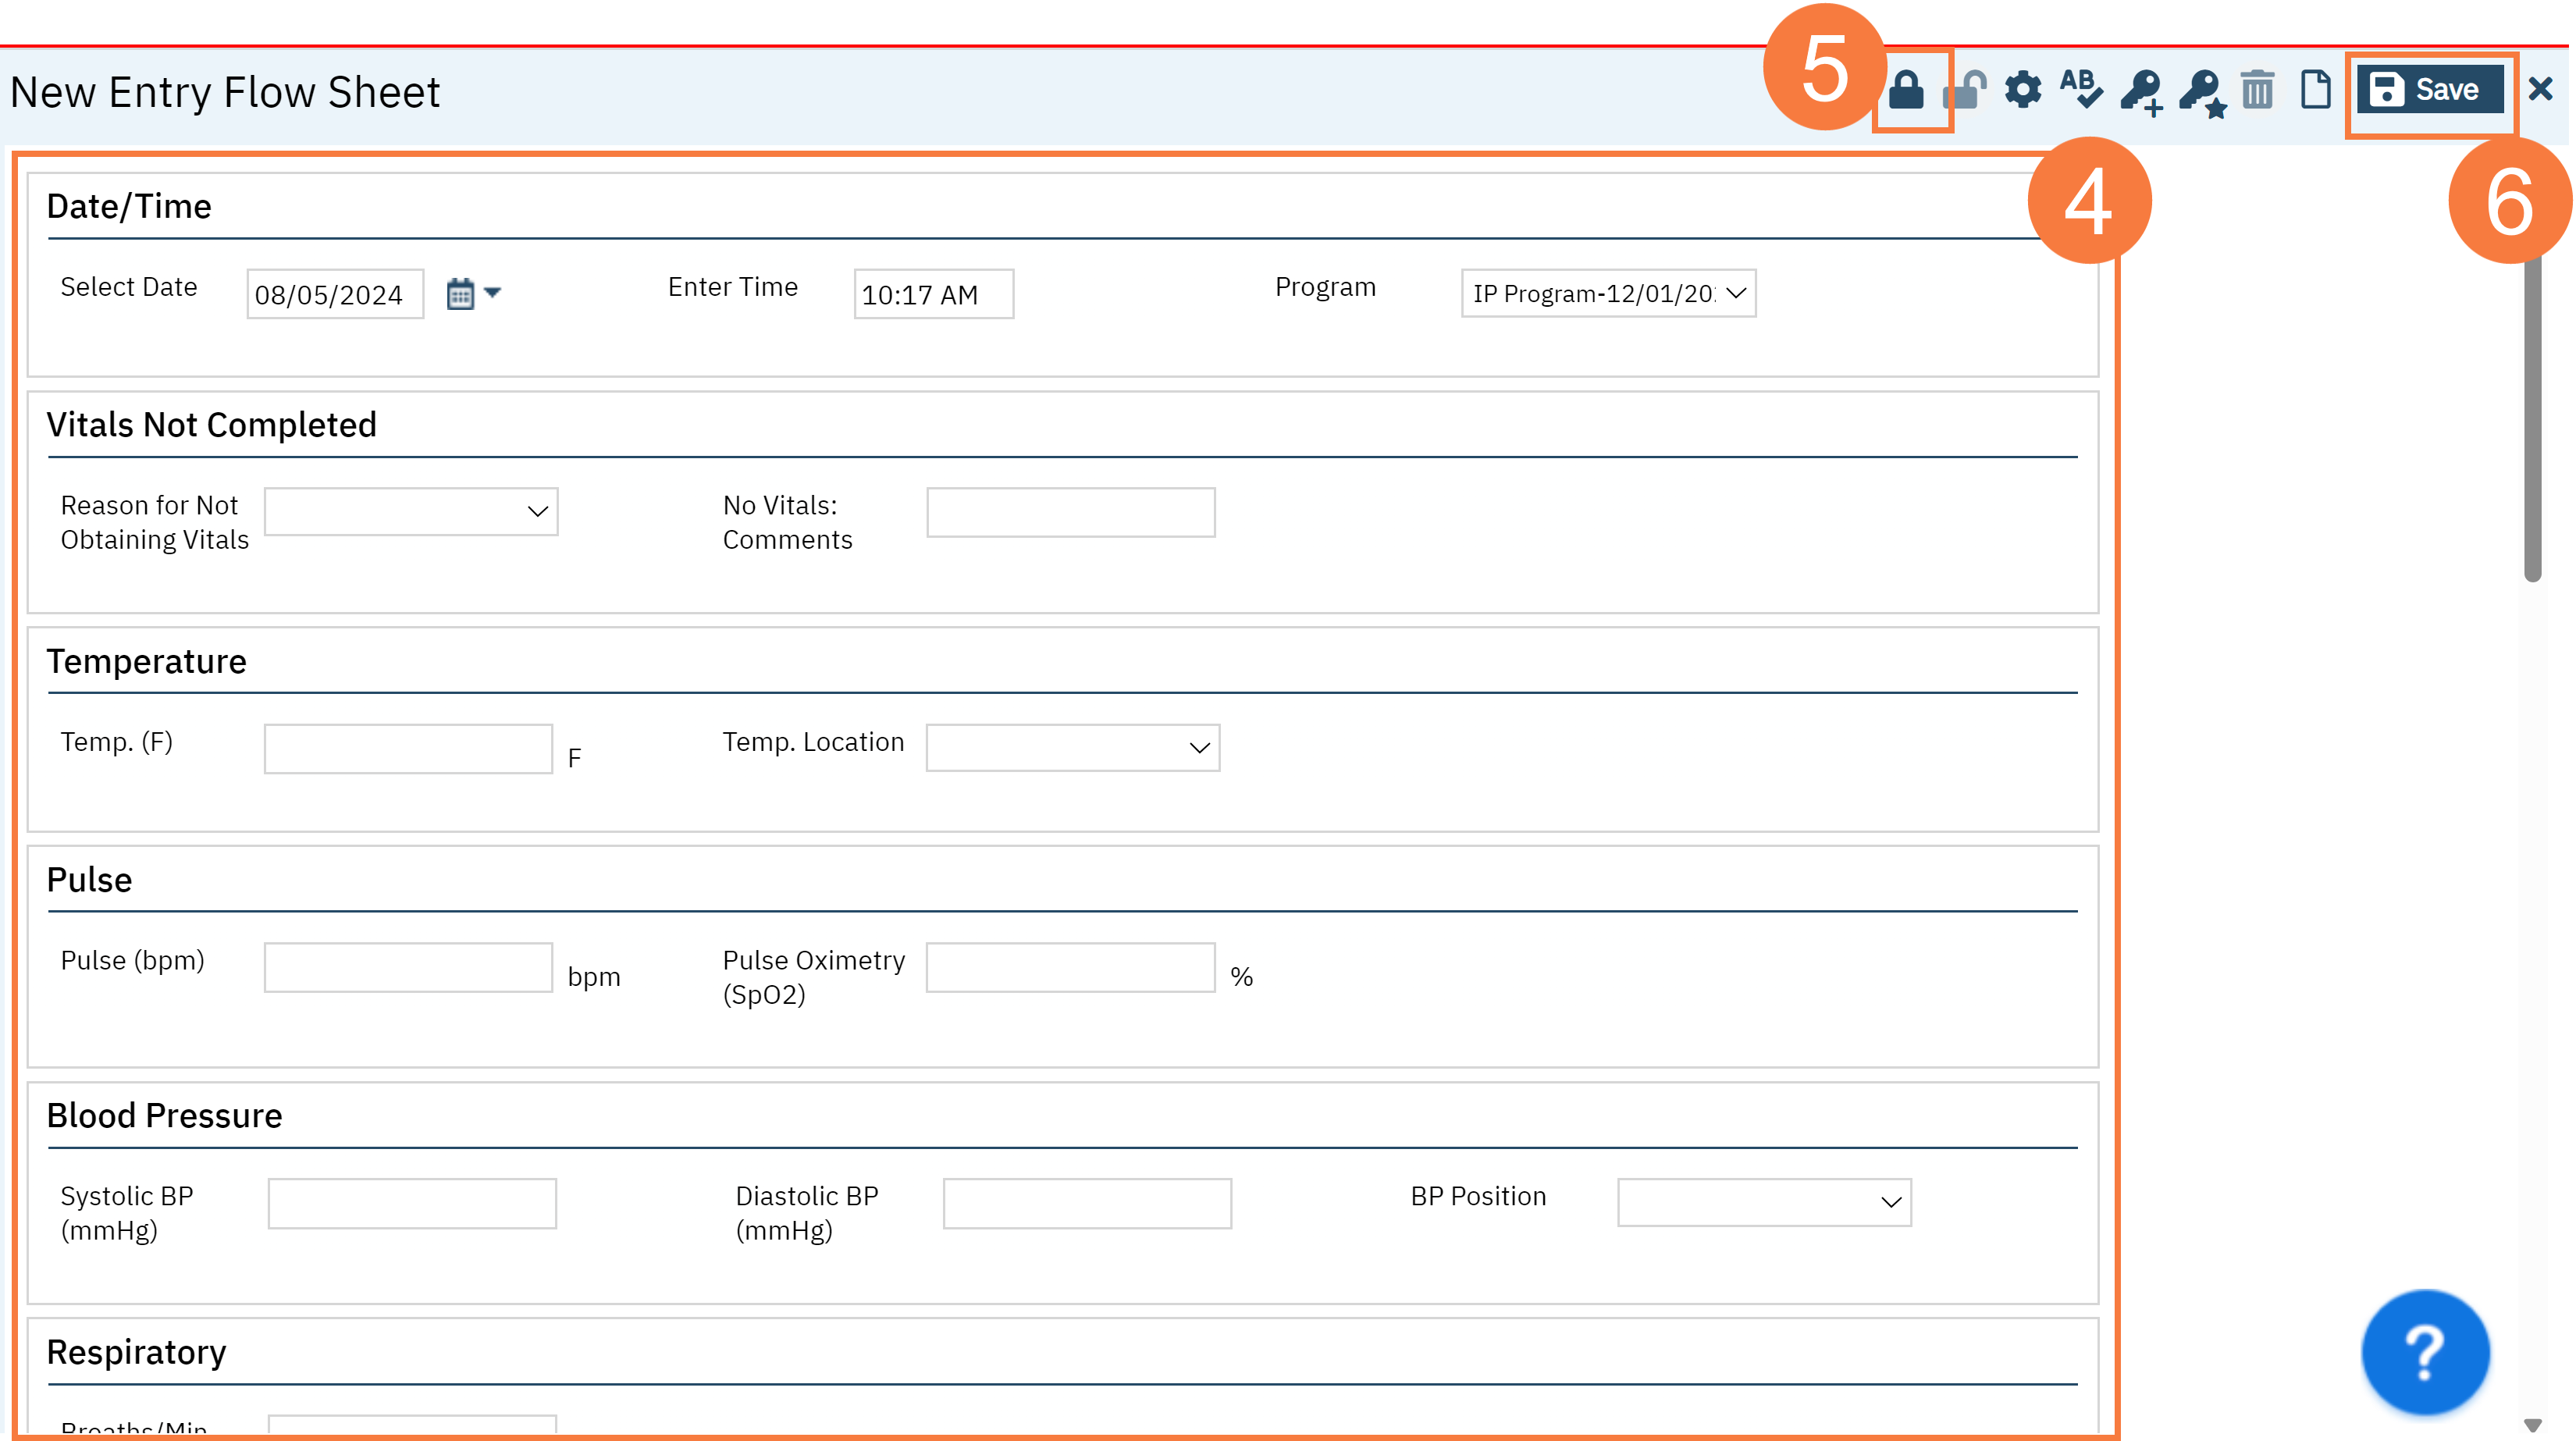
Complete the data in the Flow Sheet.
To lock the data so no one can edit it, click the Lock icon. This is optional.