This report is designed to display an overview of the login user’s productivity within a set time period. This report is available to the Clinician Supervisor, IP/CSU/Res, LPHA/Clinician, Medical Rx, Medical Supervisor, Medical IP/CSU/Res, Non-LPHA, Prescriber, County Affiliate SysAdmin, and CalMHSA SysAdmin.
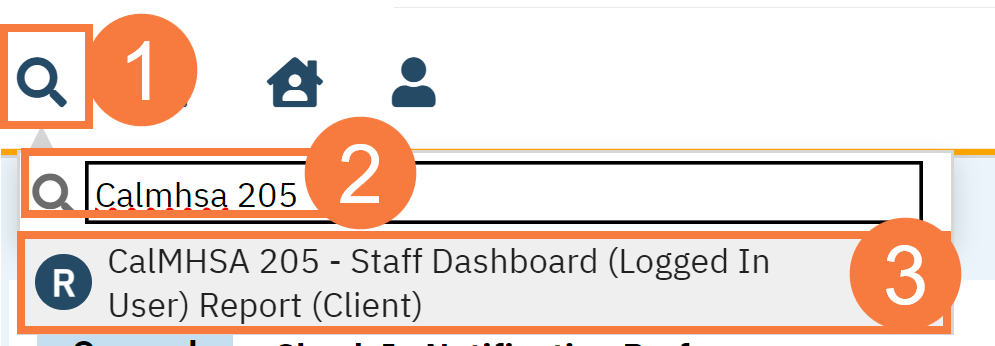
- Click on the Search icon.
- Type CalMHSA 205 in the search bar.
- Select CalMHSA 205 – Staff Dashboard (Logged in User) Report (Office) from the search results.
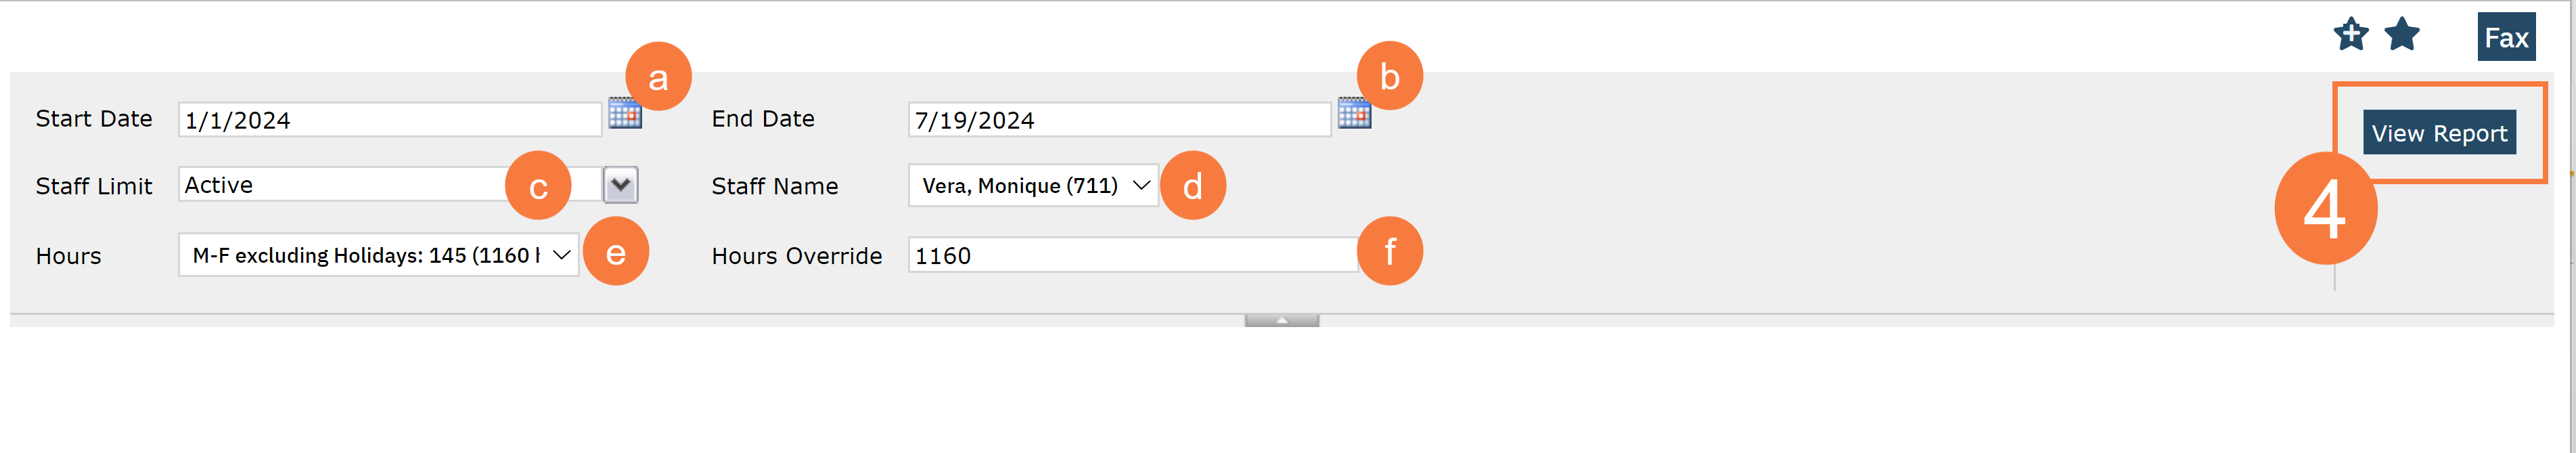
Filters
-
- Start Date: A date filter where users specify the beginning of the data range they wish to view
- End Date: A date filter where users specify the end of the data range they wish to view
- Staff Limit: A dropdown filter where users can specify to view active users, inactive users, or both
- Staff Name: A dropdown filter (The logged in user should be the only option shown on the dropdown)
- Hours: A dropdown filter where users specify the report to use either the pre-calculated hours or a custom number of hours to compare with. The calculated hours are based on the number of days M-F which are not flagged as holidays and assumes 8 hours each day. This filter is determined from the Start and End Date filters.
- Hours Override: A text fields filter where user can specify the number of hours for the report to compared with.
- Click View Report.
Report Sections
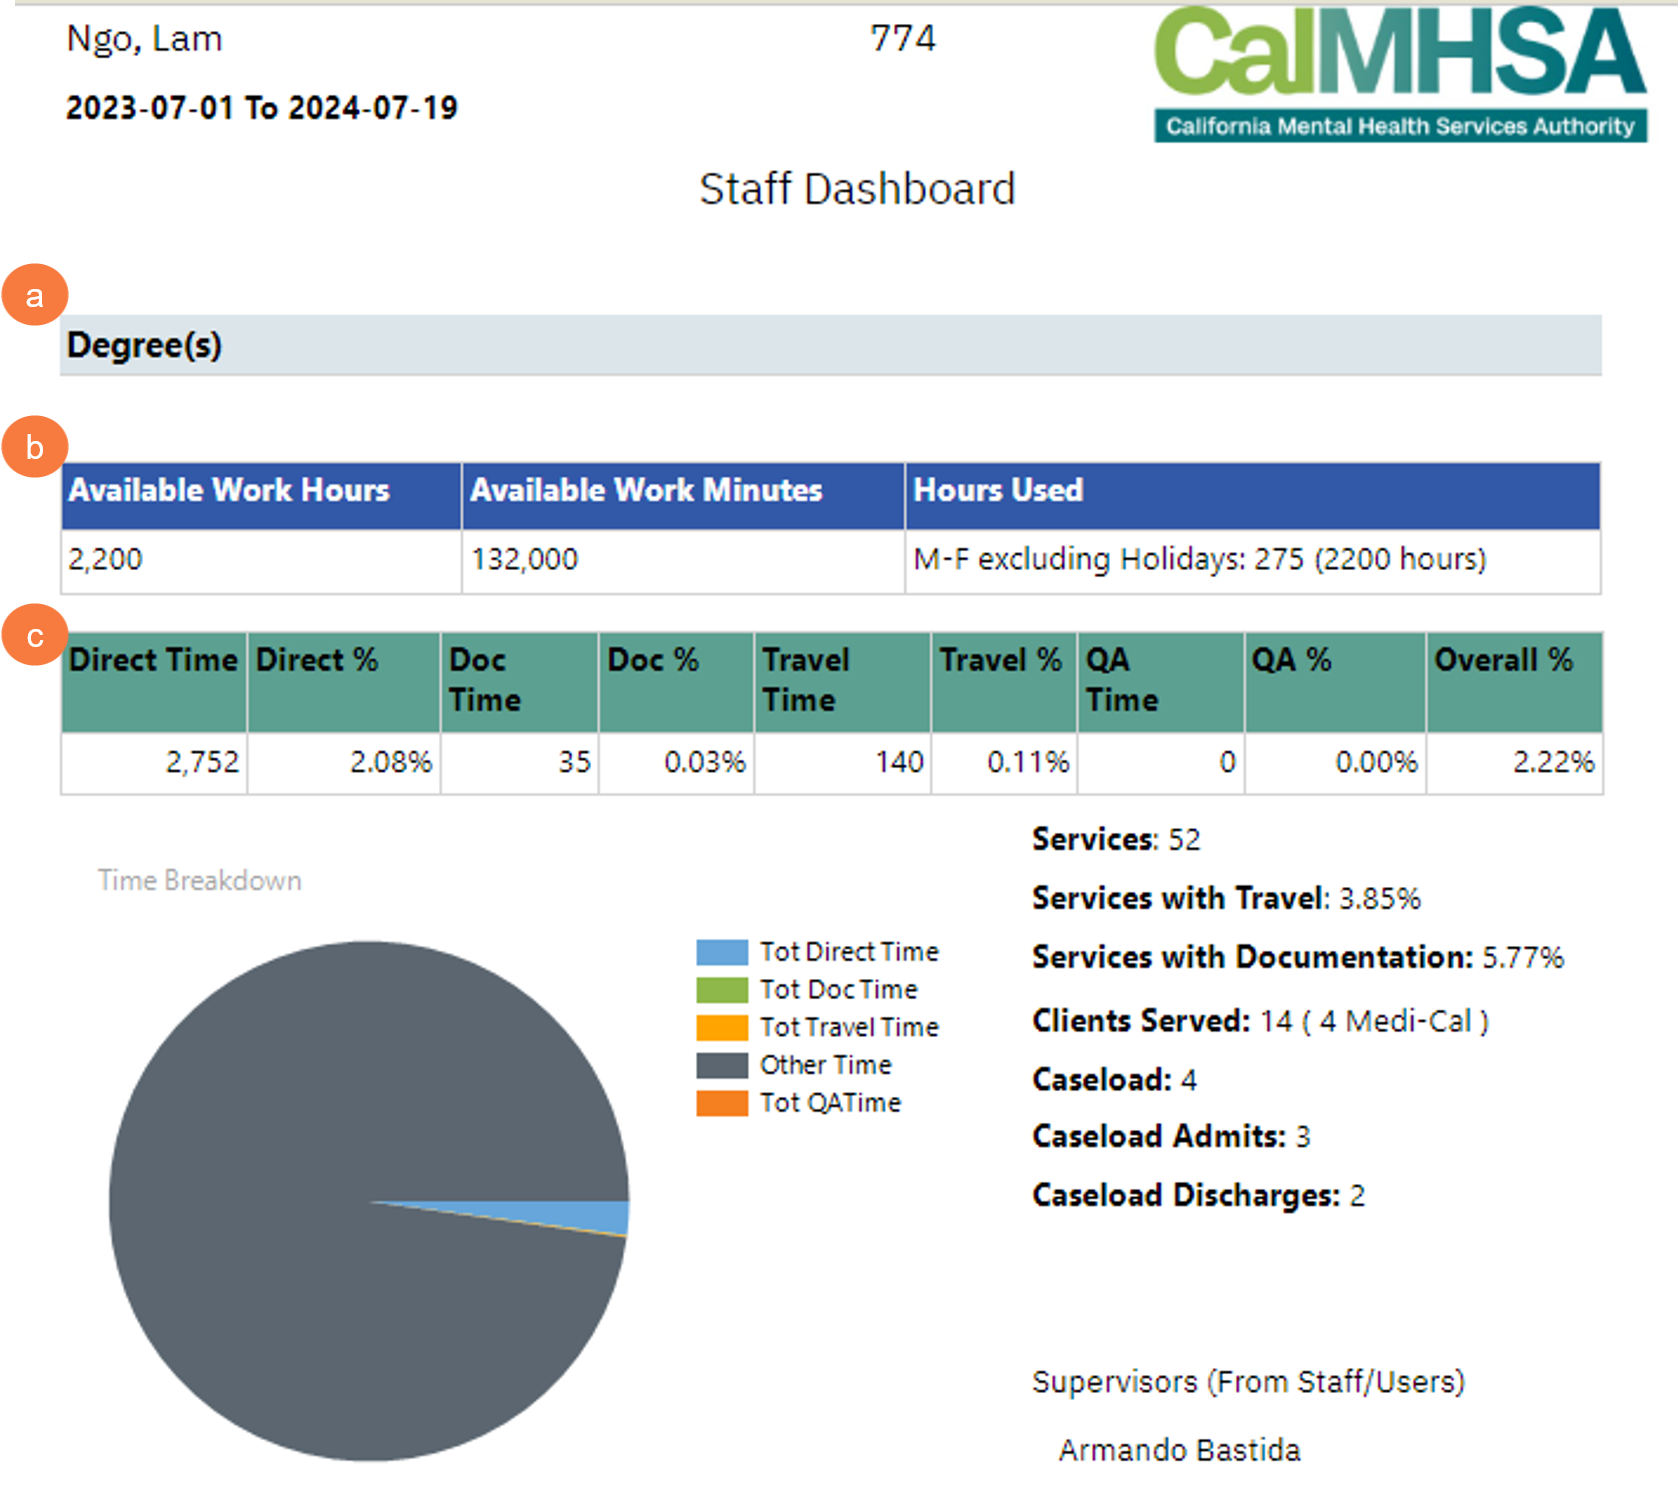
- Degree(s): Displays all available degree(s) the logged in user have
- Hours/Mins: Displays what been entered in the “Hours Override” text box, the total number of mins are in these hours, and what have been chosen in the “Hour” filter.
- Time Information: Displays the following information
- The total number of fact-to-face/service time the logged in user have documented in mins
- The percentage of direct time using the chosen hours as the denominator
- The total documentation time the logged in user have documented in mins
- The percentage of documentation time using the chosen hours as the denominator.
- The total Travel time the logged in user have documented in mins
- The percentage of those time using the chosen hours as the denominator.
- The total QI time, Mobile Crisis – Coordination, Mobile Crisis – Dispatch Activities, Mobile Crisis – Data Reporting, and Mobile Crisis – Implementation Planning that been set as “busy” by logged in user on the staff calendar in mins.
- The percentage of QI time, Mobile Crisis – Coordination, Mobile Crisis – Dispatch Activities, Mobile Crisis – Data Reporting, and Mobile Crisis – Implementation Planning time using the chosen hours as the denominator.
- A pie chart summarizing the above information.
- Total number of services the logged in user have signed.
- Total number of services that has travel time filled out
- Total number of services that has documentation time filled out.
- Total number of clients the logged in user member served (total number of them having Medi-Cal coverage)
- Total number of the logged in user member’s caseload base on clients’ treatment team.
- Total number of enrollments the logged in user’s caseload had within the selected Start and End date.
- Total number of Discharges the logged in user’s caseload had within the selected Start and End date
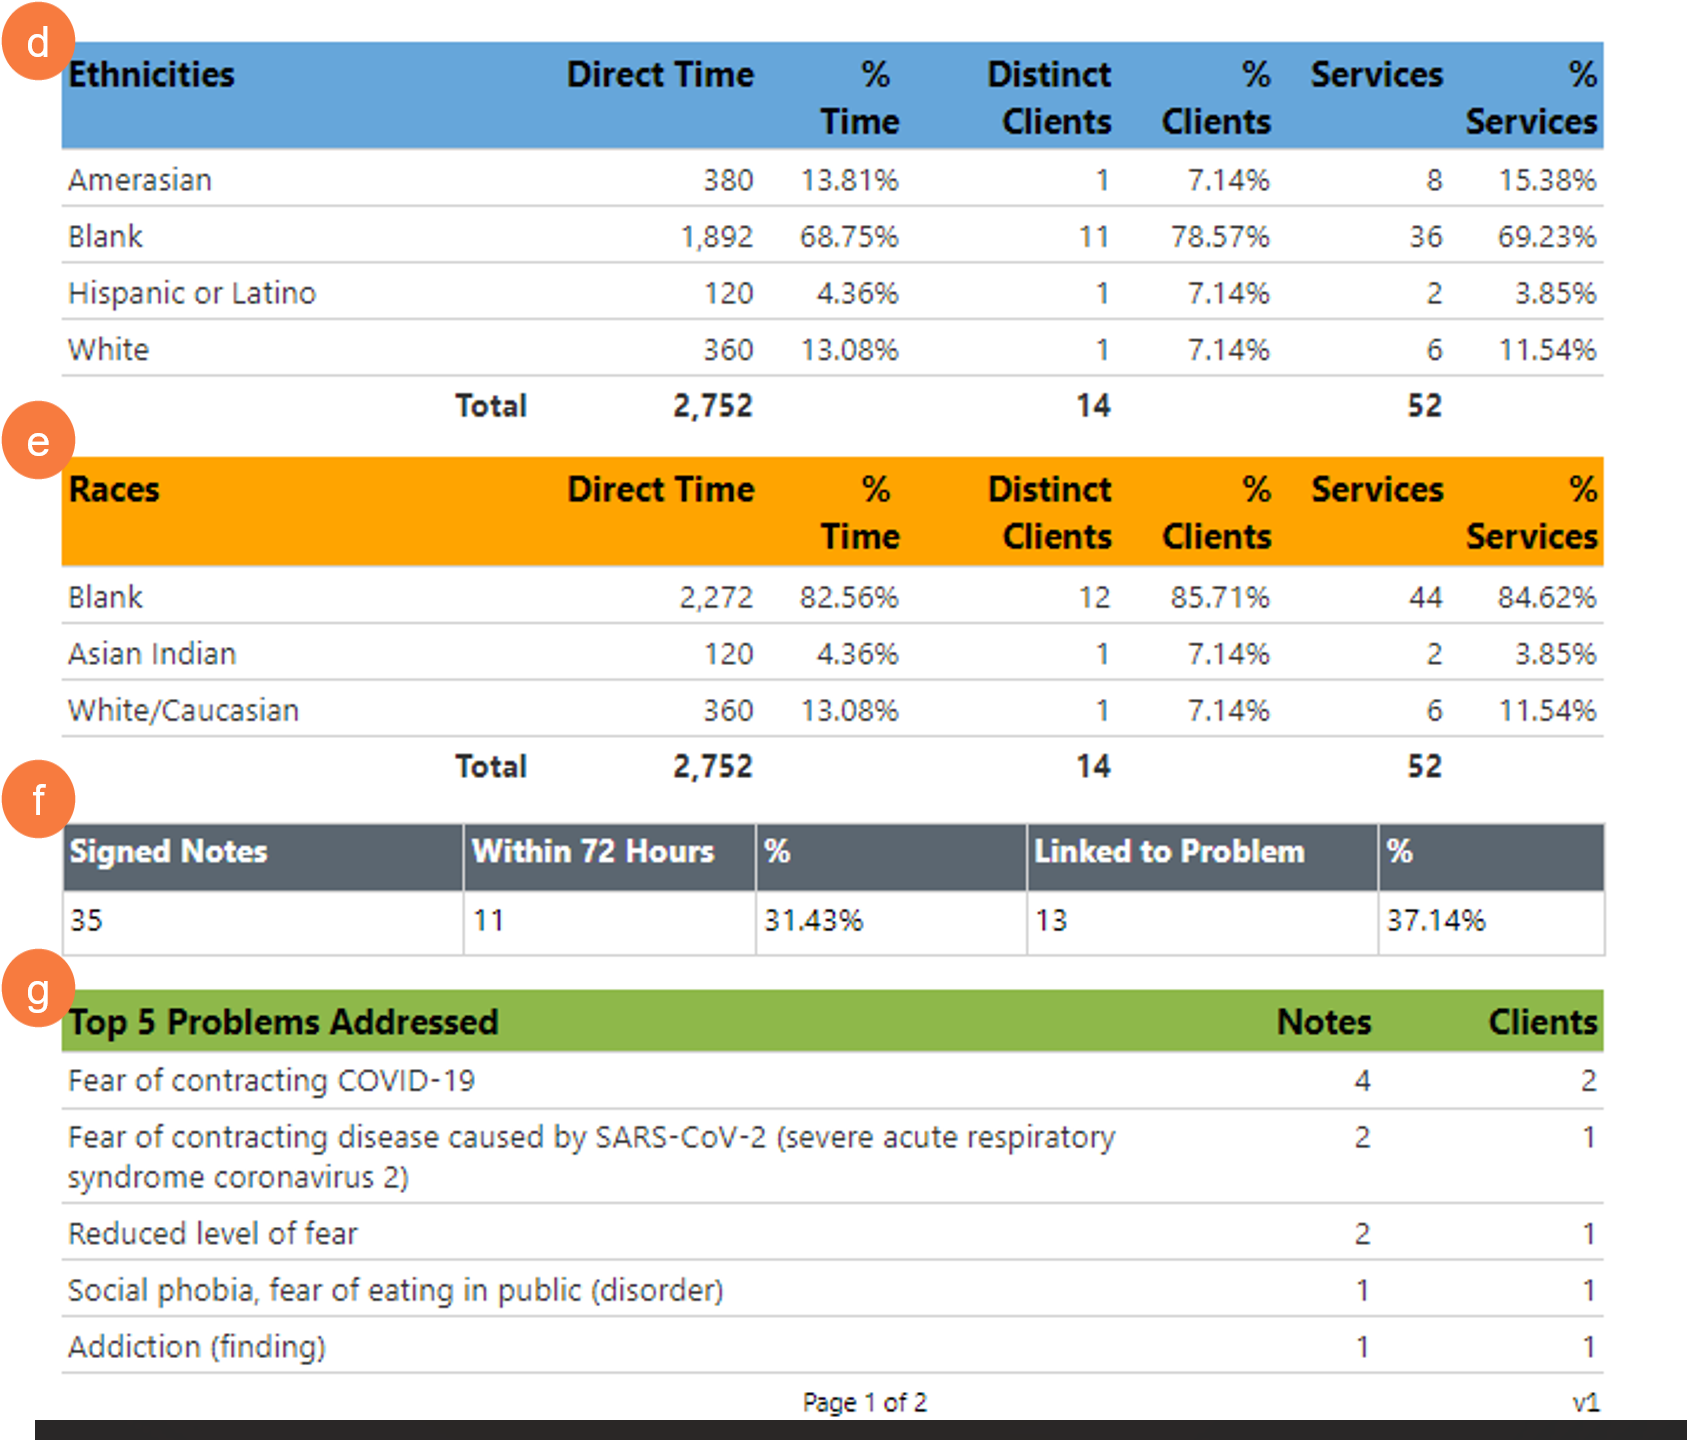
- Ethnicities: Displays the total and percentage of the following data to each Ethnicity group the logged in user member have served:
- direct time
- clients
- services
- Ethnicities: Displays the total and percentage of the following data to each Ethnicity group the logged in user member have served:
- Races: Displays the total and percentage of the following data to each Race group the logged in user member have served:
- direct time
- clients
- services
- Races: Displays the total and percentage of the following data to each Race group the logged in user member have served:
- Signed Note: Displays the following data:
- Total amount of service notes the logged in user have signed within the selected Start and End date
- The amount of signed service notes that were signed within 72 hours
- The percentage of notes signed within 72 hours using the total amount of signed note as the denominator.
- The total amount of signed service notes that was documented to have address at least one of the associated client’s problems listed in their problem list.
- Signed Note: Displays the following data:
- Top 5 Problems Addressed: Display the top 5 problems the logged in user member have addressed the most. Along with the total amount of service notes they signed, document the said problem being addressed with the total amount of clients they addressed said problem with.
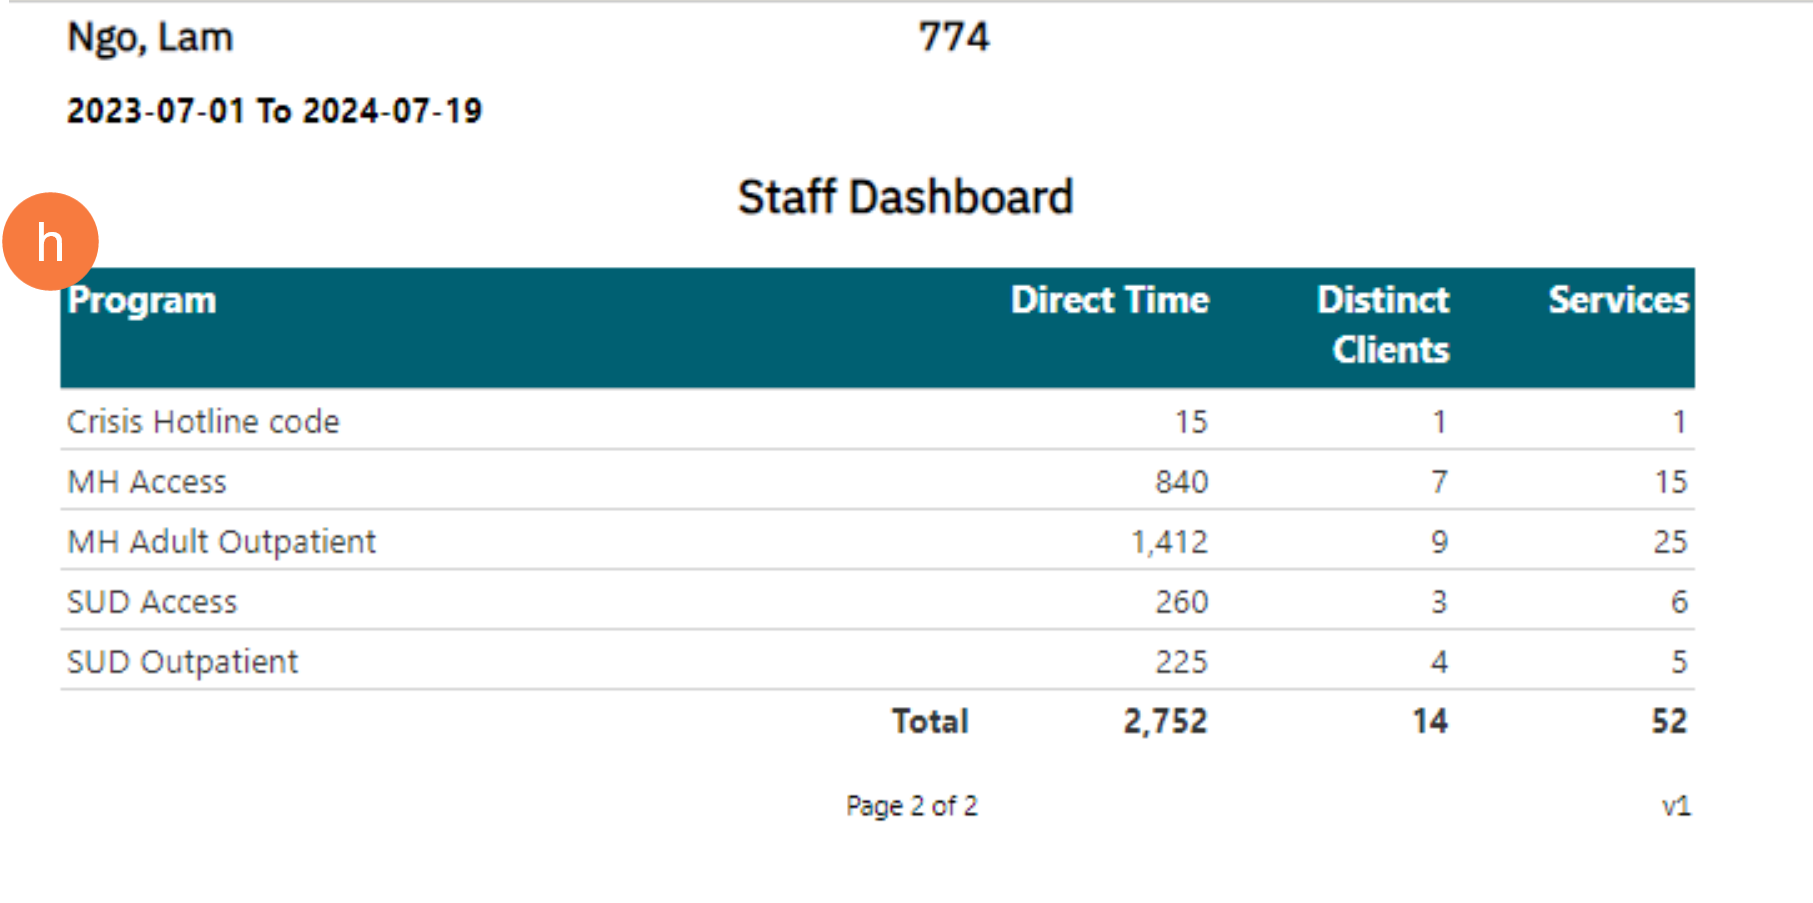
- Program: Displays all programs that the logged in user member has preform services under. The section will display the following data per each program:
- The total amount of direct time
- The total amount of clients
- The total amount of services
- Program: Displays all programs that the logged in user member has preform services under. The section will display the following data per each program: